
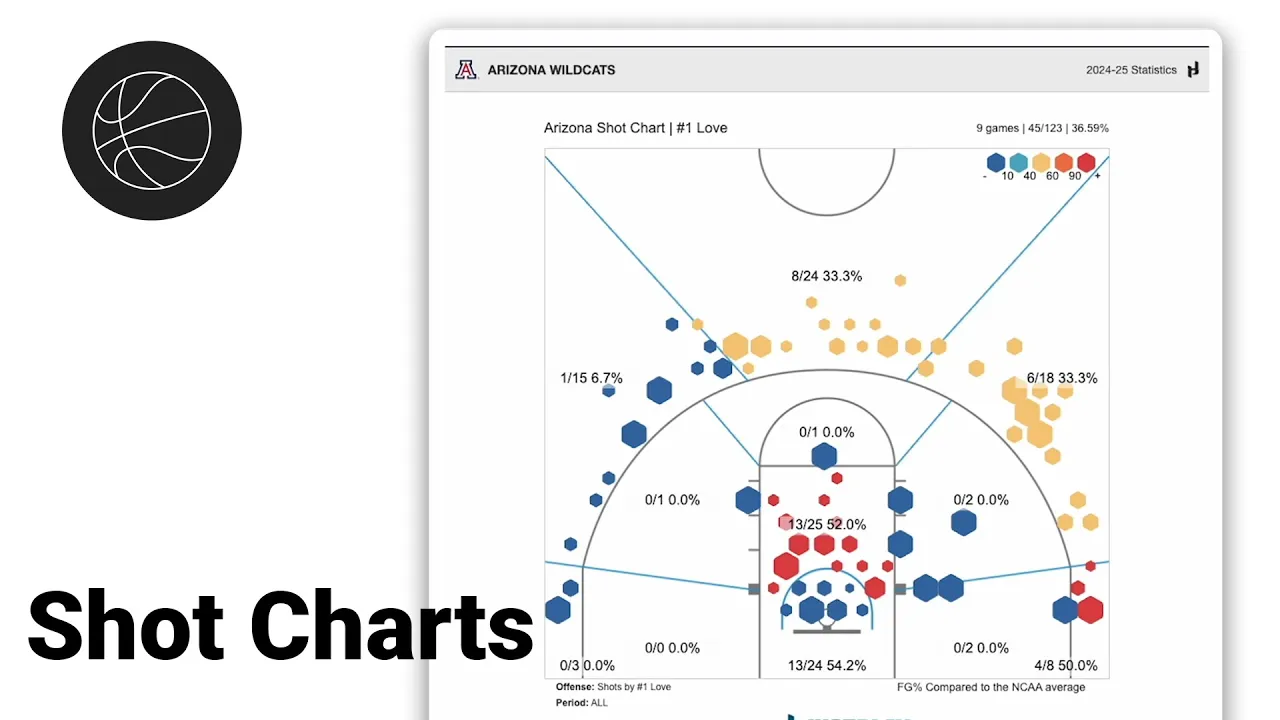
Shot Charts
|
Stat Factory
This video provides a walkthrough of the Shot Charts feature within Just Play’s Stat Factory, a tool used for analyzing basketball performance metrics.
Key features and functionalities include:
Team and Player Selection: You can analyze any Division I team or individual player, including both offensive and defensive shot charts (0:07-0:38).
Customizable Splits and Comparisons: The Games tab allows users to filter by specific sets of games, while the Comparison tab lets users benchmark data against the entire country, a specific conference, or the rest of the team (0:39-1:01).
Display Options: Users can toggle between field goal percentage, points per shot, or raw shot data (showing individual makes and misses). Further adjustments allow you to change zone visualizations (e.g., 4 or 8 zones), court colors, and scale metrics based on shot frequency or accuracy (1:02-2:06).
Situational Analysis: This is highlighted as the most powerful part of the tool. Users can filter data based on specific game conditions, such as the last five minutes of a game, the final 10 seconds of a shot clock, game score and margin, shot type, or specific scenarios like shots in the paint and second-chance points (2:07-3:04).


