
How to Use AInsights
|
Stat Factory
This video provides a step-by-step guide on how to use Auto Insights, a feature within the Just Play platform that generates customizable, data-driven written reports for sports teams and players.
Key steps to generate a report:
Navigate: Go to the Insights and Situations tab in Stat Factory (0:11).
Select: Choose a team from the Division I roster and select the specific games to include in your analysis (0:24-0:38).
Build: Click "Build report" to generate a narrative report (0:43).
Report Breakdown:
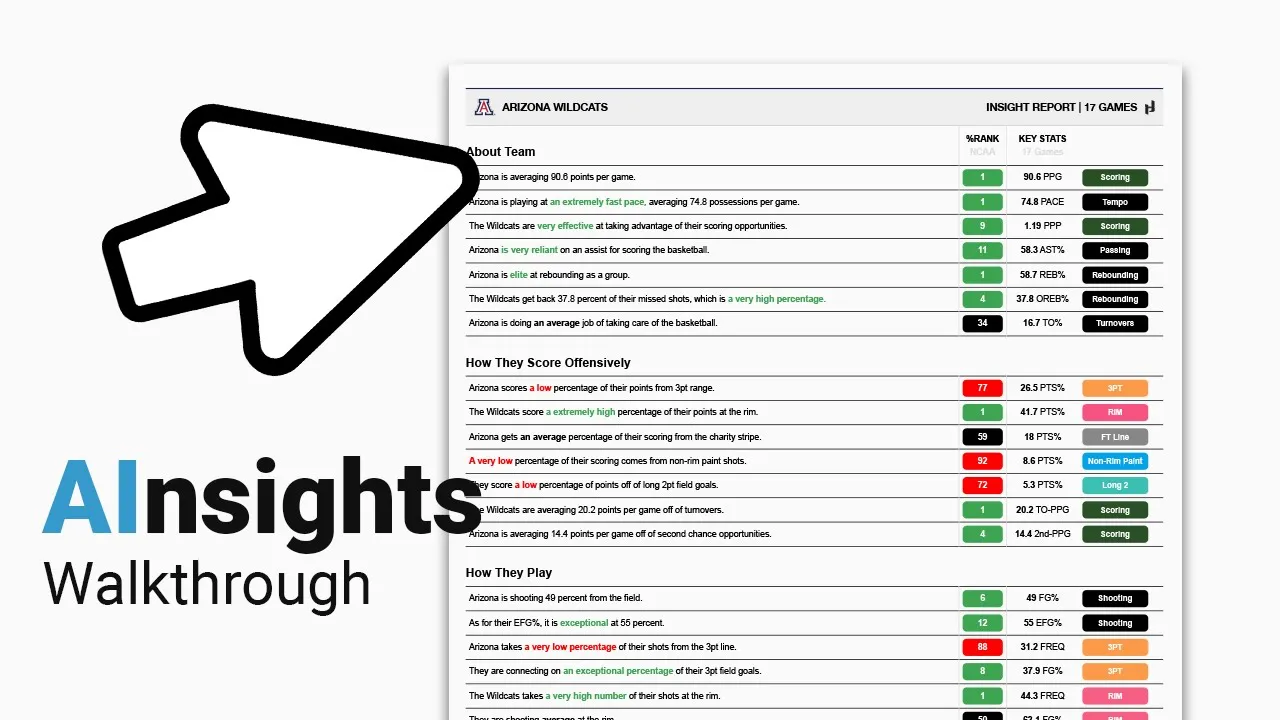
Team Analysis: Reports include sections on "About the Team," "How they score," "How they play," and "Situational analysis" (1:28-1:35). The tool uses visual cues—green for top 15%, red for bottom 30%, and black for the rest—to highlight performance (1:42-1:51). The report also allows users to review how a team performs on defense versus opponents (3:58-4:04).
Player Analysis: Users can select specific player pages to include in the report (0:57). These pages provide a breakdown of player statistics across five different splits (overall, conference play, last five games, wins, and losses) (4:07-4:29).
Customization: Users can toggle between team or national percentile rankings to provide context based on their scouting needs (4:41-4:46).


