
Overview Reports
|
Stat Factory
This video provides a tutorial on using the Overview Reports feature within the Just Play Stat Factory platform for basketball coaching and scouting.
Key Features of Overview Reports:
Customization: Users can select any Division I team or specific set of players to generate detailed reports (0:07 - 0:21).
Report Controls:
Features Tab: Toggle specific sections on or off (0:22 - 0:29).
Games Tab: Filter reports by specific game splits or sets of games (0:30 - 0:39).
Situation Tab: Filter by game half, clock settings, or scoring margins (0:39 - 1:01).
Fields Tab: Choose which statistics are displayed in trends graphs (1:02 - 1:12).
Report Components:
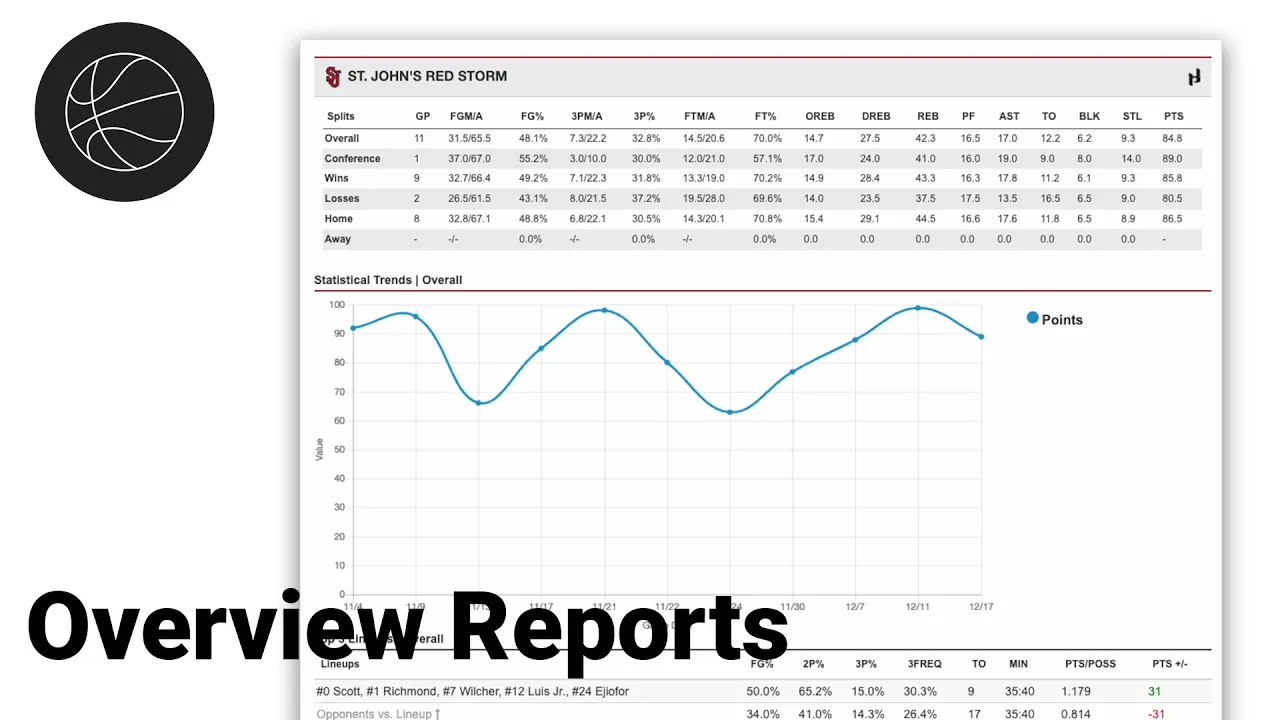
Statistical Trends Line Graph: A dynamic, game-by-game visual representation of selected stats, which can be adjusted to analyze specific performances (1:23 - 2:15).
Lineup Analysis: Identifies a player's top three most frequent lineups and provides performance metrics like points per possession and overall plus-minus (2:16 - 2:51).
Shooting Section: Uses pie charts and tables to illustrate shot locations (e.g., at the rim vs. paint), efficiency, and assist/unassisted rates (2:52 - 4:03).
Practical Applications:
Scouting: Coaches can use this data to understand how to guard specific players or identify a player's preferred scoring methods (3:19 - 3:24).
Reporting: The tool generates a clean, printable one-page PDF that assistant coaches can easily share with head coaches during the scouting process (4:05 - 4:33).


